

The PEG ratio compares the forward P/E ratio to a forecast of future earnings growth, a common screen. P/B is based on expected return on equity, ROE, so a similar screen to potentially challenge the P/B ratio can be calculated:
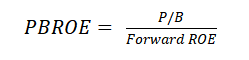
(This will only work for positive ROE.) P/B is determined fundamentally by what book value will earn in the future, that is, expected ROE, so a low PBROE (low P/B relative to expected ROE) suggests a mispriced stock. But the measure comes with the same warning about a trap as with PEG: P/B can be low because the risk to future ROE is high. Further, P/B is determined by the future ROE stream over many years, not just forward ROE, so growth in ROE must also be incorporated. Tread softly.
At December 31, 2024, the PRROE for the S&P 500 stood at 0.235. Here is measure on the same day in previous years, along with the subsequent year’s return for the index:
| Year | PBROE | Return |
|---|---|---|
| 2023 | 0.193 | 25.02% |
| 2022 | 0.189 | 26.29% |
| 2021 | 0.227 | -18.11% |
| 2020 | 0.260 | 28.71% |
| 2019 | 0.197 | 18.40% |
| 2018 | 0.160 | 31.49% |
| 2017 | 0.196 | -4.38% |
| 2016 | 0.182 | 21.83% |
| 2015 | 0.172 | 11.96% |
The PBROE can also be calculated with trailing ROE. Here are PBROE ratios for selected stocks in January 2025 on that basis:
| Company | P/B | PBROE |
|---|---|---|
| HSBC Holdings plc (HSBC) | 0.93 | 0.074 |
| General Motors Company (GM) | 0.79 | 0.056 |
| Ford Motor Company (F) | 0.91 | 0.114 |
| Alibaba Group Holding Limited (BABA) | 1.56 | 0.175 |
| LGI Homes, Inc. (LGIH) | 1.09 | 0.105 |
| Jet2 plc (DGI.F) | 1.74 | 0.053 |
| China Sunshine Paper Holdings (2002.HK) | 0.40 | 0.043 |
To give some perspective, a firm with a required return of 10% and an expected ROE of 10% should trade at a P/B of 1.0 (no value added to book value). LGI Homes above with a P/B of 1.09 and an ROE of 10.4% is close to this benchmark.