

Chapter 7 goes through a financial statement analysis that identifies the drivers of residual income. Can these numbers be combined into a score that indicates how they forecast future residual income? That is a question of how they are weighted into a score such that
Forecasting score = w1A1 + w2A2 + w3A3 + ……
where the A numbers are the drivers and the w are the weights given to the drivers.
This has been attempted, though can probably be improved upon. (Get to work!) The score is called an S-score (an income sustainability score) with a high S-score indicating a higher probability of RNOA increasing and a low S-score indicating a higher probability of RNOA decreasing.
Here is how the S-score tracks RNOA:
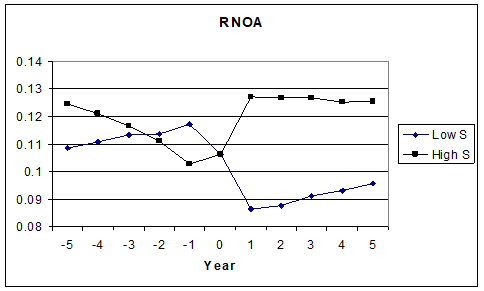
Year 0 is the year that the financial statement analysis to calculate the S-score is carried out. A high S-score is one in the top 1/3 of scores, a low S-score is one in the lowest 1/3. In the plot, the S-scores forecasts the actual RNOA five years ahead. The difference between the future RNOAs for low and high S-scores is quite significant, about 4%.
The S-score also predicts stock returns. Here are the average difference between returns from investing in high S-scores versus low S-scores, adjusted for firm size:
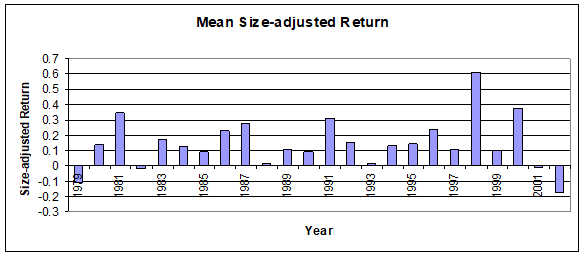
These are returns from going long on high S-scores and short on low S-scores. They are positive almost every year. The graphs need to be updated for post-2002 years.
See Penman, S., and X. Zhang. 2006. Modeling Sustainable Earnings and P/E ratios with financial Statement Information. At https://ssrn.com/abstract=318967.