Here is a report on U.S. sell-side analysts’ stock recommendations from August 2019 to December 2023 with a comparison to those of Chinese analysts. The data for U.S. analyst recommendations are from I/B/E/S. For China, they are from CSMAR (China Stock Market and Accounting Research Database) with ST (Special Treatment) stocks excluded. There are 328,899 U.S. recommendation ratings, 609,749 Chinese recommendations
Source: Thesis by Jing Yuan for the Masters Program in Accounting and Fundamental Analysis, Columbia Business School, Effectiveness of Security Analysts’ Recommendations: Insights from China and the U.S., December 2024.
Distribution of Ratings
The following graphs summarizes the distribution of ratings. The ratings use the I/B/E/S standardized IRECCD ratings ranging from 1 to 5, where 1 represents Strong Buy, 2 represents Buy, 3 represents Hold, 4 represents Sell, and 5 represents Strong Sell. CSMAR applies standardized 1-5 recommendation ratings for Chinese analysts: 1 represents Buy (买入), 2 represents Overweight (增持), 3 represents Hold (持有), 4 represents Underweight (减持), and 5 represents Sell (卖出). The 1-5 rankings are broadly comparable.
Ratings in both countries are shewed towards BUY, more so in China.
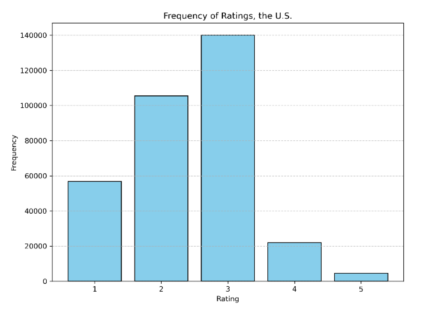
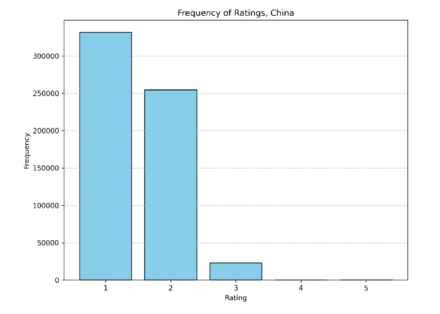
Sell recommendations are relatively rare. Is this because the firms that analysts select to cover are those with better prospects? Is it because analysts tend to have in upward bias? Is it because analysts associated with brokerage houses are inducing us to trade?
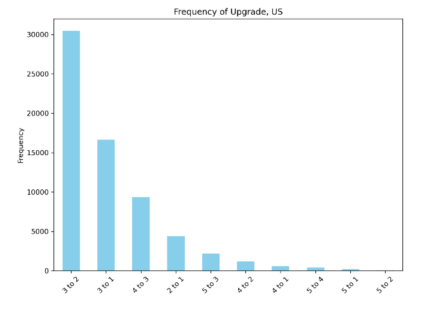
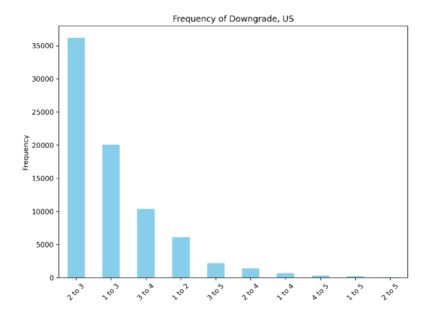
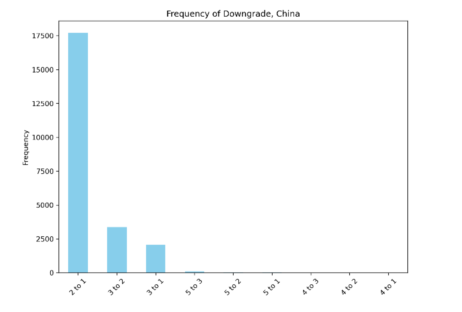
Recommendation revisions are viewed as the most informative feature of analysts’ reports. The following gives the frequency of recommendation upgrades and downgrades from one level to another.
The U.S:
China:
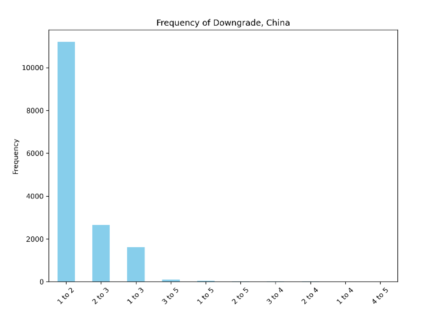
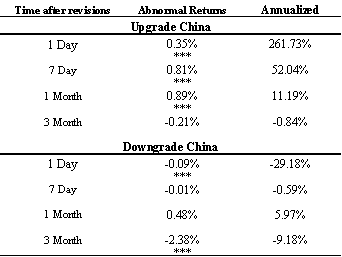
Do analysts’ recommendations revisions predict stock returns? Here are the findings from this sample period. The tables give the average return for holding periods following the revision. Returns are excess (abnormal) returns over the market return, that is, the return for the target stock minus the return on the market for the period. *** indicates statistical significance at the 1% level, ** at the 5% level.
U.S.: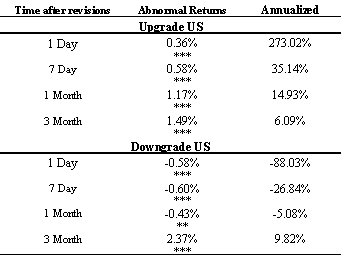
China: